

In this article, we will discuss 4 approaches to benchmark functions in Python
The first 3 methods will help us measure the execution time of a function while the last method will help us measure the memory usage.
Table of Contents
- Using the time library
- Using timeit
- Using line_profiler
- Using memory_profiler
- Conclusion
Using the time library
This is one of the simplest ways to calculate the execution time of a function. We essentially get the time in seconds right before and after we invoke the function. The difference between the two can give us an estimate of the time of the function. I say estimate since this measures the time for a single run. A better benchmark would be running it multiple times and calculating the average time taken.
import time
def func():
   lst = [i for i in range(100000)]
   start = time.perf_counter()
func()
print(f"Completed Execution in {time.perf_counter() - start} seconds")
Below is the output
Completed Execution in 0.007916 seconds
Using timeit
Timeit is a built-in method in Python. It lets us specify the number of times we want to run the function, this helps us to calculate the average time the function takes. This is a better measure than the execution time of a single run. However, for a complex function that takes a long time, this method may not be ideal.
The general syntax is below
timeit.Timer(funcName).timeit(number=number)
number is the number of times we want the function to be executed. It returns the sum of all individual runtimes. To get the average, we can just divide the sum by the number of runs.
Below is how we would measure the average execution time of our function func()
import timeit
num_runs = 10
duration = timeit.Timer(func).timeit(number = num_runs)
avg_duration = duration/num_runs
print(f'On average it took {avg_duration} seconds')
The output is below
On average it took 0.004649160000000001 seconds
We can also use the repeat() method to run the experiment (running the function n times) multiple times. In simpler terms, if we consider an experiment as running our function func() 10 times, we can do this experiment 3 times and get the execution time of each experiment.
The general syntax is
timeit.Timer(funcName).repeat(repeat=num_repetions,number=num_runs)
Below is using it to benchmark our function func()
num_runs = 10
num_repetions = 3
ex_time = timeit.Timer(func).repeat(
                     repeat=num_repetions,
                     number=num_runs)
print(f'It took {ex_time}')
This will return the following output
It took [0.0494772, 0.04936369999999998, 0.048738000000000004]
Similar to the timeit() method, it returns the total time for the 10 runs. We can use the max() to get the worst time, min() to get the best time, and sum(lst)/len(lst) to get the average execution time.
Using line_profiler
line_profiles is a really cool library that gives a line-by-line analysis of a function. Before using the library, we will need to install it
conda install -c anaconda line_profiler
We will need to add a decorator before our function
@profile
def func():
    lst = []
    for i in range(100000):
       lst.append(i)
Since line-profiler provides a line-by-line analysis, it doesn’t make much sense to use it with a list comprehension.
Typ the following commands in the Anaconda Prompt
kernprof -l main.py
python -m line_profiler main.py.lprof
The first command runs our python script and stores the logs in a file. The second command displays the logs in the form of an easy-to-understand table.
Below is the output of the second command
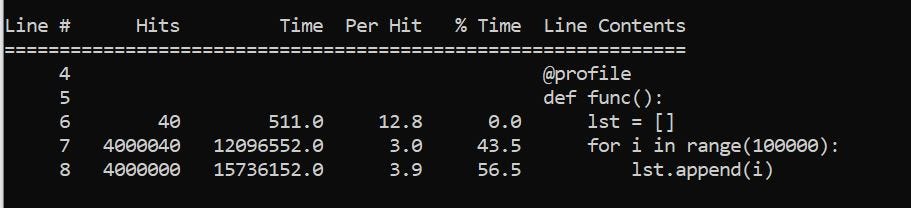 Screenshot of line_profiler
- Hit- The number of times that line was executed.
- Time- Total time taken by that line
- Per Hit- Average time taken by the line
- % Time- Fraction of total execution time. As we can see from the above picture, the append function takes around 57% of the execution time.
If you want to change the number of times the function is executed for line_profiler, use the following code
prof = profile(func)
for i in range(10):
   prof()
This will run the function 10 times.
Using Memory_profiler
It is pretty similar to line_profiler, the difference being the logs generated tell us about the memory usage instead of time taken.
First, we will need to install the library
conda install -c anaconda memory_profiler
We will have to add the same decorator as before
@profile
def func():
    lst = []
    for i in range(100000):
       lst.append(i)
Then type the following command in the Anaconda Prompt
python -m memory_profiler main.py
Below is the output
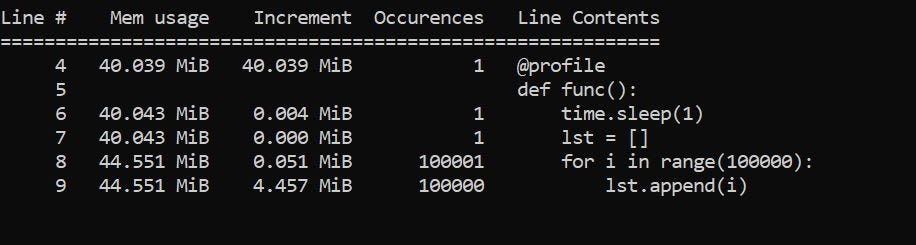 Screenshot of memory_profiler
- Mem usage- The total memory usage at the line
- Increment- memory usage by each execution of that line
- Occurrences- number of times the line was executed
Conclusion
If you want a quick time performance test of a piece of code or a function, you should try measuring the execution time using the time library. However, if you want a better estimate, consider using the timeit library.
If you want a more detailed line-by-line analysis, consider using line-profiler and memory-profiler.
Connect with me on LinkedIn
I recently started a modified version of the #100daysofcode challenge. I aim to write content related to Python, Data Science, or Programming every day. Follow my progress on Twitter, Medium, Dev.to, Hashnode, or my WordPress Blog